
Mumbai: Rajasthan, India’s seventh most populous state, which goes to the polls on December 7, 2018, with Telangana, registered a 7% growth rate, exceeding the national average. But it has not been able to use this growth to create enough jobs, improve women’s literacy or combat high maternal and child mortality rates.
IndiaSpend compared Rajasthan’s indicators on health, agriculture, unemployment with 11 other states, using diverse sources, such as the National Family Health Survey (NFHS), National Sample Survey Organisation (NSSO) and Niti Aayog. We picked these 12 states for their size and development: Punjab, Karnataka, Tamil Nadu, Jharkhand, Maharashtra, Gujarat, Rajasthan, Chhattisgarh, Bihar, Uttar Pradesh, Madhya Pradesh and Kerala.
At 7.2%, Rajasthan’s gross state domestic product (GSDP) growth in 2017-18 was higher than the national GDP growth of 6.7%. However, it ranks eighth in our 12-state list. (table below)

Agriculture, industry prospered but employment fell
Rajasthan’s agriculture output grew 23% from Rs 119,103 crore ($24 billion) in 2011-12 to Rs 145,948 crore ($23 billion), as the table below shows. Compared to the 11 states we analysed, Rajasthan ranked fifth, with Madhya Pradesh registering the highest growth (67%) over the last eight years. However, under the current Bharatiya Janata Party (BJP) government, led by chief minister Vasundhara Raje Scindia, agricultural output grew only by 9% between 2013-14 and 2017-18.
Further, the state’s secondary sector, including manufacturing, construction and electricity, grew by 28%, and the services sector by 40%, according to 2017-18 data from ministry of statistics and programme implementation.

However, this growth has not been able to propel employment. Unemployment–usually underestimated in official data–in Rajasthan increased from 1.7% in 2011-12 to 7.1% in 2015-16, according to the labour bureau data. In 2011-12, rural unemployment was 1.6% but it rose to 7.7% in 2015-16. The unemployment rate in urban areas increased from 2% to 4.3% over the same period.
Infant, under-five and maternal mortality are yet to be controlled
On health indices, Rajasthan ranks fourth in NITI Aayog rankings (which are based on health outcomes, governance and information and key inputs and processes). But its infant and under-five mortality rank third worst in our analysis. This is despite the fact that infant mortality declined from 65 deaths per 1,000 births in 2005-06 to 43 in 2015-16 and under-five mortality fell from 85 to 50 over the same period. The national average for these is 41 and 49, respectively, according to sample registration survey data of 2015-16.

The state does well compared to the national average for institutional births–it enjoys an average of 84% while the national average is 78.9%. Its record for antenatal care (82.7%) too exceeds the national average of 79.3%.
Maternal health remains a concern in the state–its maternal mortality rate (MMR) stands at 199 deaths per 100,000 live births, the third highest in the country. The state’s sex ratio, 973 per 1,000 boys, ranks fifth among the 12 states in our analysis. It also ranks fourth lowest in vaccination coverage–54.8%.

More health facilities, but they are plagued by shortages
Rajasthan’s primary healthcare infrastructure improved since 2005-06, but it has yet to deal with vacancies. Access and power supply to these facilities, too, remain inadequate.
| Health Infrastructure Indicators For Rajasthan | ||
|---|---|---|
| Indicators | 2010-11 | 2017-18 |
| Sub-centres | 11487 | 14406 |
| Primary Health Centres (PHC) | 1528 | 2079 |
| Community Health Centres (CHC) | 368 | 579 |
| Doctors possessing recognised medical qualifications | 28797* | 40,559 |
| Vacancy of specialists in district hospitals | 41.5# | 45.8^ |
| District hospitals | 33 | 34 |
| Sub-centres without female health worker/ANM | 328 | 1775 |
| PHCs functioning without a doctor | 70 | 167 |
| Shortfall of surgeons at CHCs | 218 | 452 |
| Shortfall of physicians at CHCs | 206 | 390 |
| Shortfall of total specialists at CHCs | 980 | 1819 |
| Medical officer posts vacant at PHCs | Surplus | 282 |
| Sub-centres without regular water supply | 21.80% | 34.90% |
| Sub-centres without electric supply | 7.50% | 36.10% |
| Sub-centres without all-weather motorable approach road | 2.60% | 10.20% |
| PHCs with labour room | 79.30% | 80.00% |
| PHCs with 4-6 beds | 99.90% | 77.80% |
| PHCs without regular water supply | 0.00% | 10.20% |
| PHCs without electric supply | 0.00% | 4.60% |
| PHCs without all-weather motorable approach road | 0.00% | 7.80% |
| PHCs with referral transport facility | 36.20% | 65.90% |
| CHCs with all four specialists | 20.10% | 7.40% |
| CHCs with functional laboratory | 98.40% | 96.50% |
| CHCs with functional O.T | 81.50% | 77.70% |
| CHCs with functional labor room | 98.40% | 95.60% |
| CHCs with referral transport facility | 77.20% | 91.50% |
Source: Rural Health Statistics 2017 and National Family Health Survey 2015-16
*refers to 2010, #refers to 2014-15, ^refers to 2015-16
The number of sub-centres increased by 25%, primary health centres by 36% and community health centres by 57% between 2010-11 and 2017-18, according to rural health statistics 2017. However, this increase in the health facilities has not seen an equal increase in medical health professionals and adjoining infrastructure.
For example, the number of primary health centres functioning without a doctor has gone up from 70 in 2010-11 to 167 in 2017-18. The number of sub-centres without an auxiliary nurse or female health worker increased from 328 in 2010-11 to 1,775 in 2017-18.
The lack of physical infrastructure has also risen–sub centres without regular water supply increased from none in 2010-11 to 10% in 2017-18, while the PHCs without all-weather motorable approach road went from none to 8% over the same time period, according to rural health statistics of 2010-11 and 2017-18.
Poor ratings in women’s literacy, employment
Women’s education indicators could explain the state’s poor ratings in children’s health and maternal health: States with more educated women show better health outcomes for children, as IndiaSpend reported on March 20, 2017.

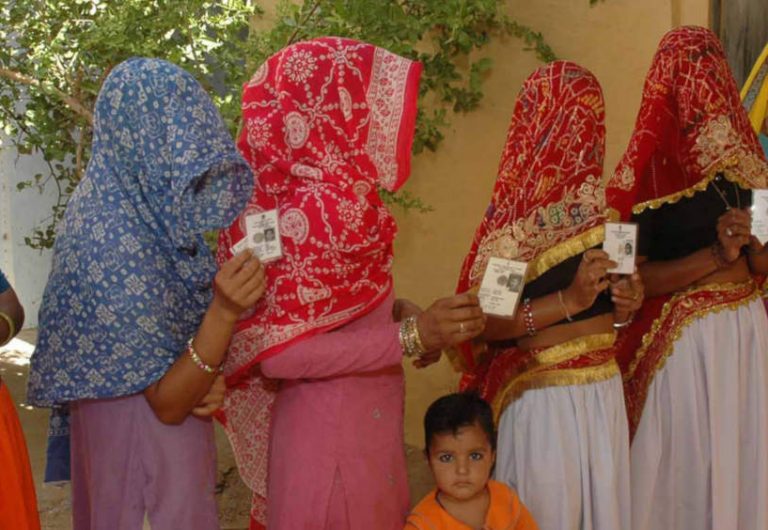
The table above shows that in Rajasthan, women’s literacy and participation in the economy are low. The state ranks second lowest in women’s literacy–56.5% to the national average of 68.4%, according the 2015-16 NFHS. It is last in the list of women who have completed 10-11 years of education.
Female participation in the labour force is 21.5%, lower than the national average of 23.7%.
(Salve is a programme manager at IndiaSpend.)
Courtesy: India Spend